

The Bandwidth Analytics page provides insights into how much bandwidth has been used over time for video streaming and other activities. This tool helps you monitor and optimize bandwidth usage, ensuring efficient resource allocation.
Overview of the Bandwidth Analytics Page
Key Features:
-
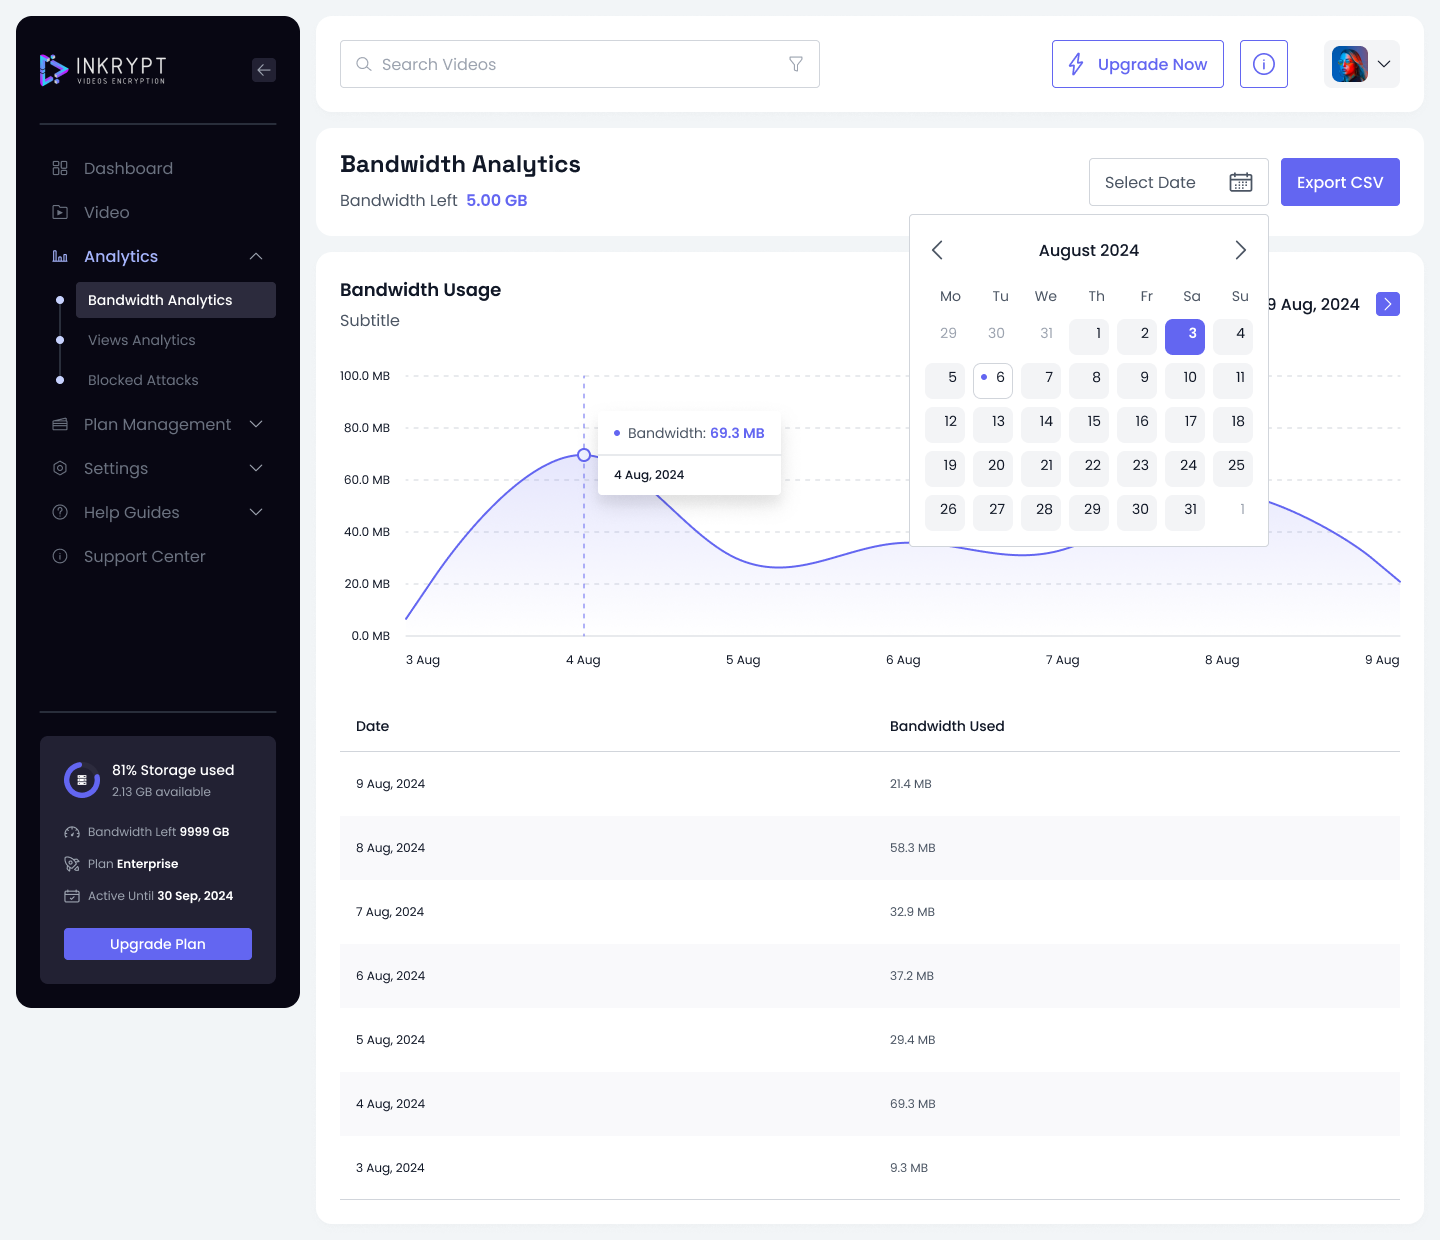
Bandwidth Usage Graph:
- A line graph displays the bandwidth usage over a selected date range.
- Hover over data points to view exact bandwidth usage for a specific day.
- Example: "Bandwidth: 69.3 MB on August 4, 2024."
-
Date Selector:
- Use the calendar widget to filter bandwidth usage by specific dates or a date range.
- Quickly analyze usage patterns for any desired time period.
-
Export CSV:
- Download a detailed CSV report of your bandwidth usage for further analysis or record-keeping.
Bandwidth Usage Table
Below the graph, a table provides a breakdown of daily bandwidth usage.
Columns:
- Date: The specific day the data corresponds to.
- Bandwidth Used: The amount of bandwidth consumed on that day.
How to Use Bandwidth Analytics
-
Track Usage Trends:
- Use the graph to identify days with high or low bandwidth consumption.
- Spot trends and correlate with video uploads or high-viewership events.
-
Filter Data by Date:
- Use the date selector to focus on specific timeframes, such as a single day, week, or month.
-
Export Reports:
- Generate and download CSV files to share with your team or analyze in other tools.
Benefits of Bandwidth Analytics
- Resource Management:
- Understand how bandwidth is allocated across your video library.
- Optimize Costs:
- Identify opportunities to reduce bandwidth consumption and associated costs.
- Monitor Trends:
- Detect unusual spikes or drops in bandwidth usage and investigate their causes.
By leveraging Bandwidth Analytics, you can maintain efficient operations and ensure optimal use of your resources.