

Analytics Sections
Overview
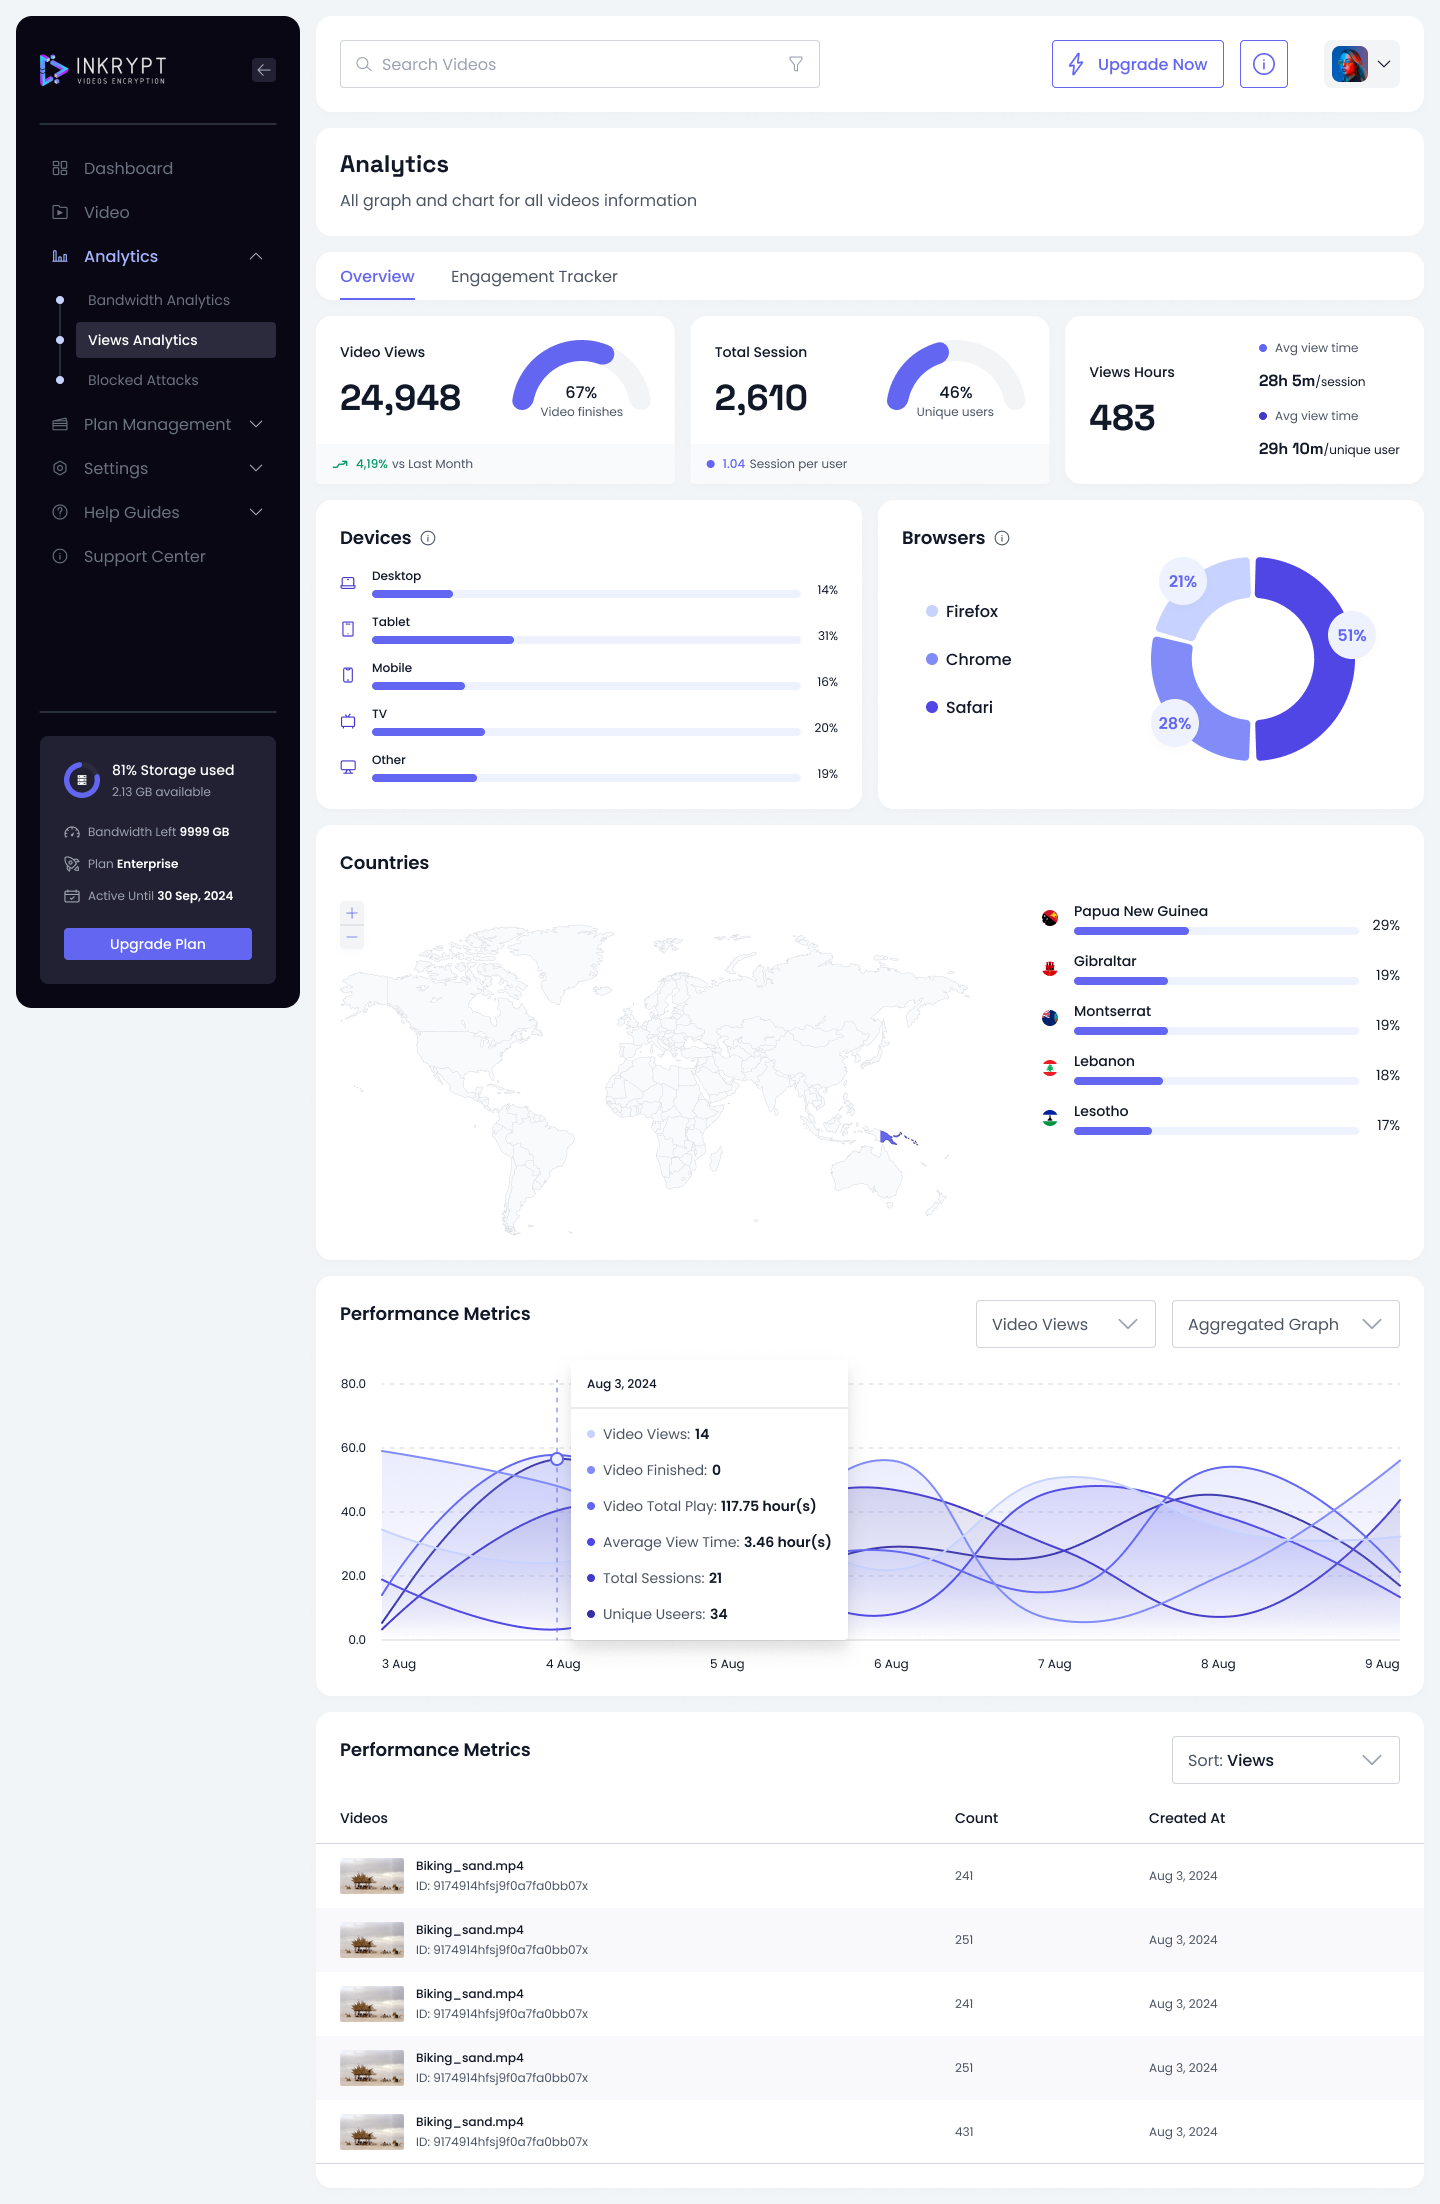
The Overview tab gives a quick summary of your video's performance, including the following key metrics:
- Video Views: Total number of views your videos received.
- Video Finishes: Percentage of videos watched until the end.
- Total Sessions: Number of times users interacted with your videos.
- Unique Users: Percentage of users who watched your content for the first time.
- View Hours: Total time users spent watching your videos, including averages per session and user.
Overview of the Engagement Tracker
All Videos View
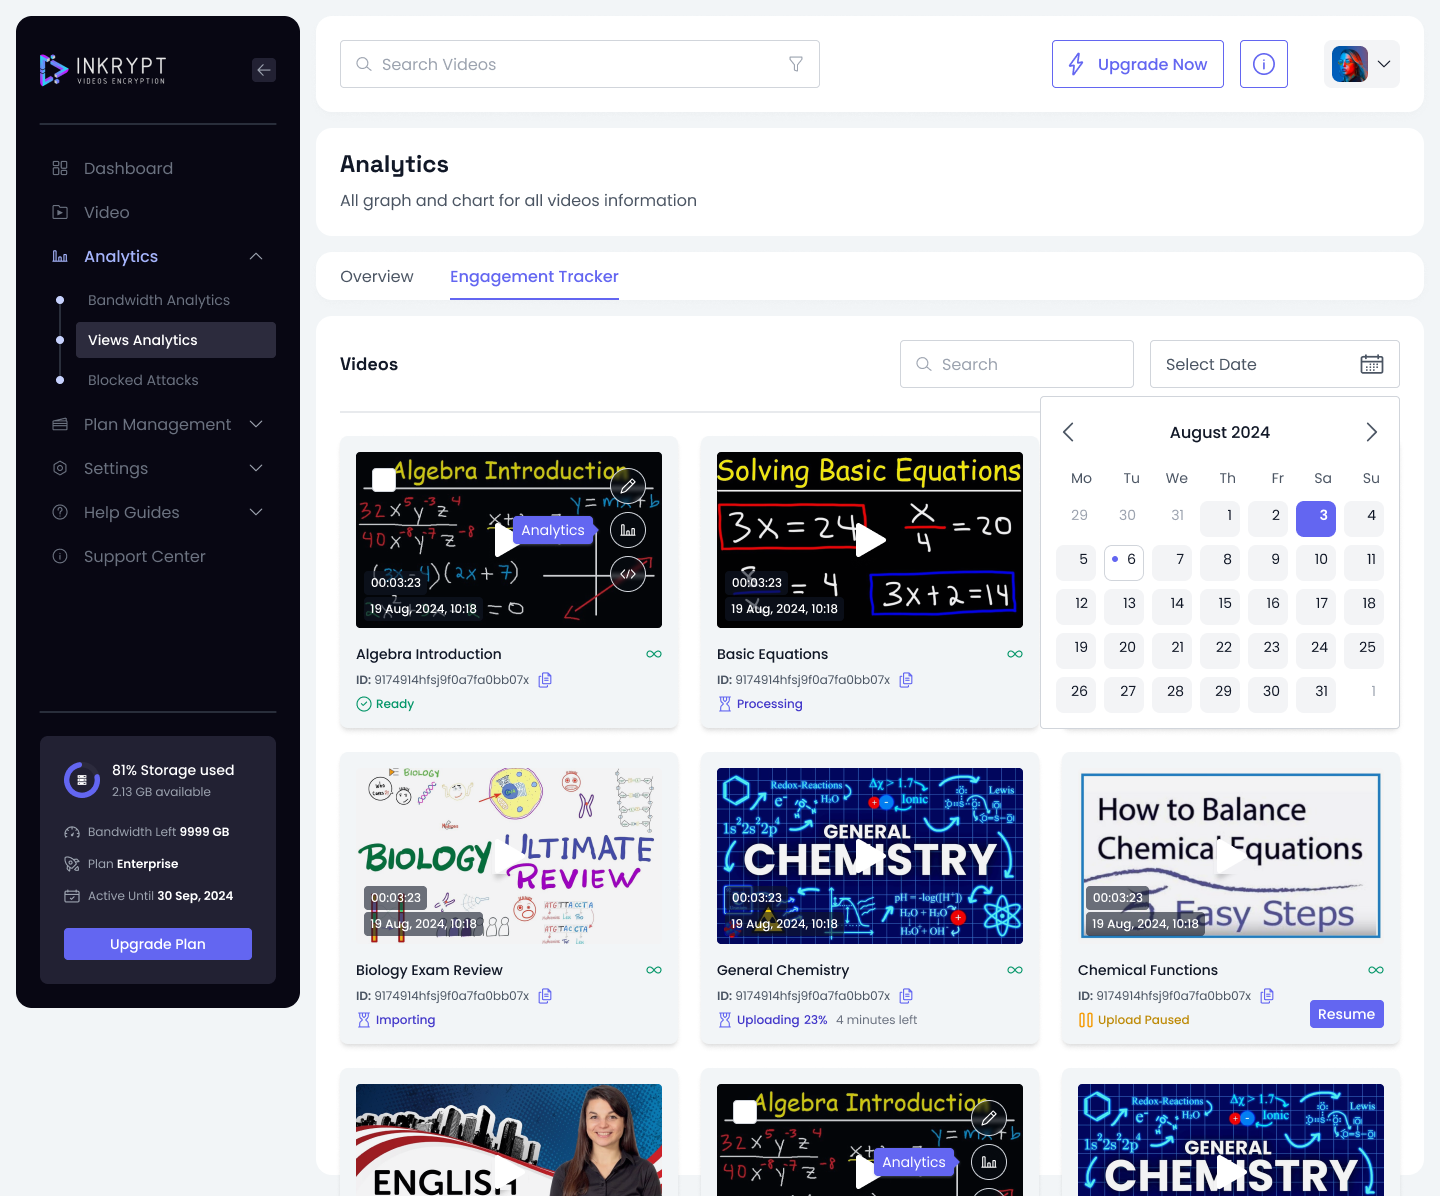
The first page of the Engagement Tracker lists all the videos in your library. This overview provides key performance indicators for each video at a glance.
Features:
- Video Thumbnail: A visual representation of the video.
- Video Title and ID: The title and unique identifier for quick reference.
- Status Tags: Indicators such as
Ready,Processing, orImportingto display the current state of each video. - Engagement Analytics Button: Click on the analytics icon to access detailed data for a specific video.
Search and Filter Options:
- Search Bar: Locate videos quickly using keywords.
- Date Selector: Narrow down results by selecting a date or date range.
Engagement Tracker
The Engagement Tracker in the Analytics section provides detailed insights into how your videos are performing. This feature enables you to monitor engagement trends across all your videos and dive deeper into data for individual videos.
The first page of the Engagement Tracker lists all the videos in your library. This overview provides key performance indicators for each video at a glance.
Features:
- Video Thumbnail: A visual representation of the video.
- Video Title and ID: The title and unique identifier for quick reference.
- Status Tags: Indicators such as
Ready,Processing, orImportingto display the current state of each video. - Engagement Analytics Button: Click on the analytics icon to access detailed data for a specific video.
Search and Filter Options:
- Search Bar: Locate videos quickly using keywords.
- Date Selector: Narrow down results by selecting a date or date range.
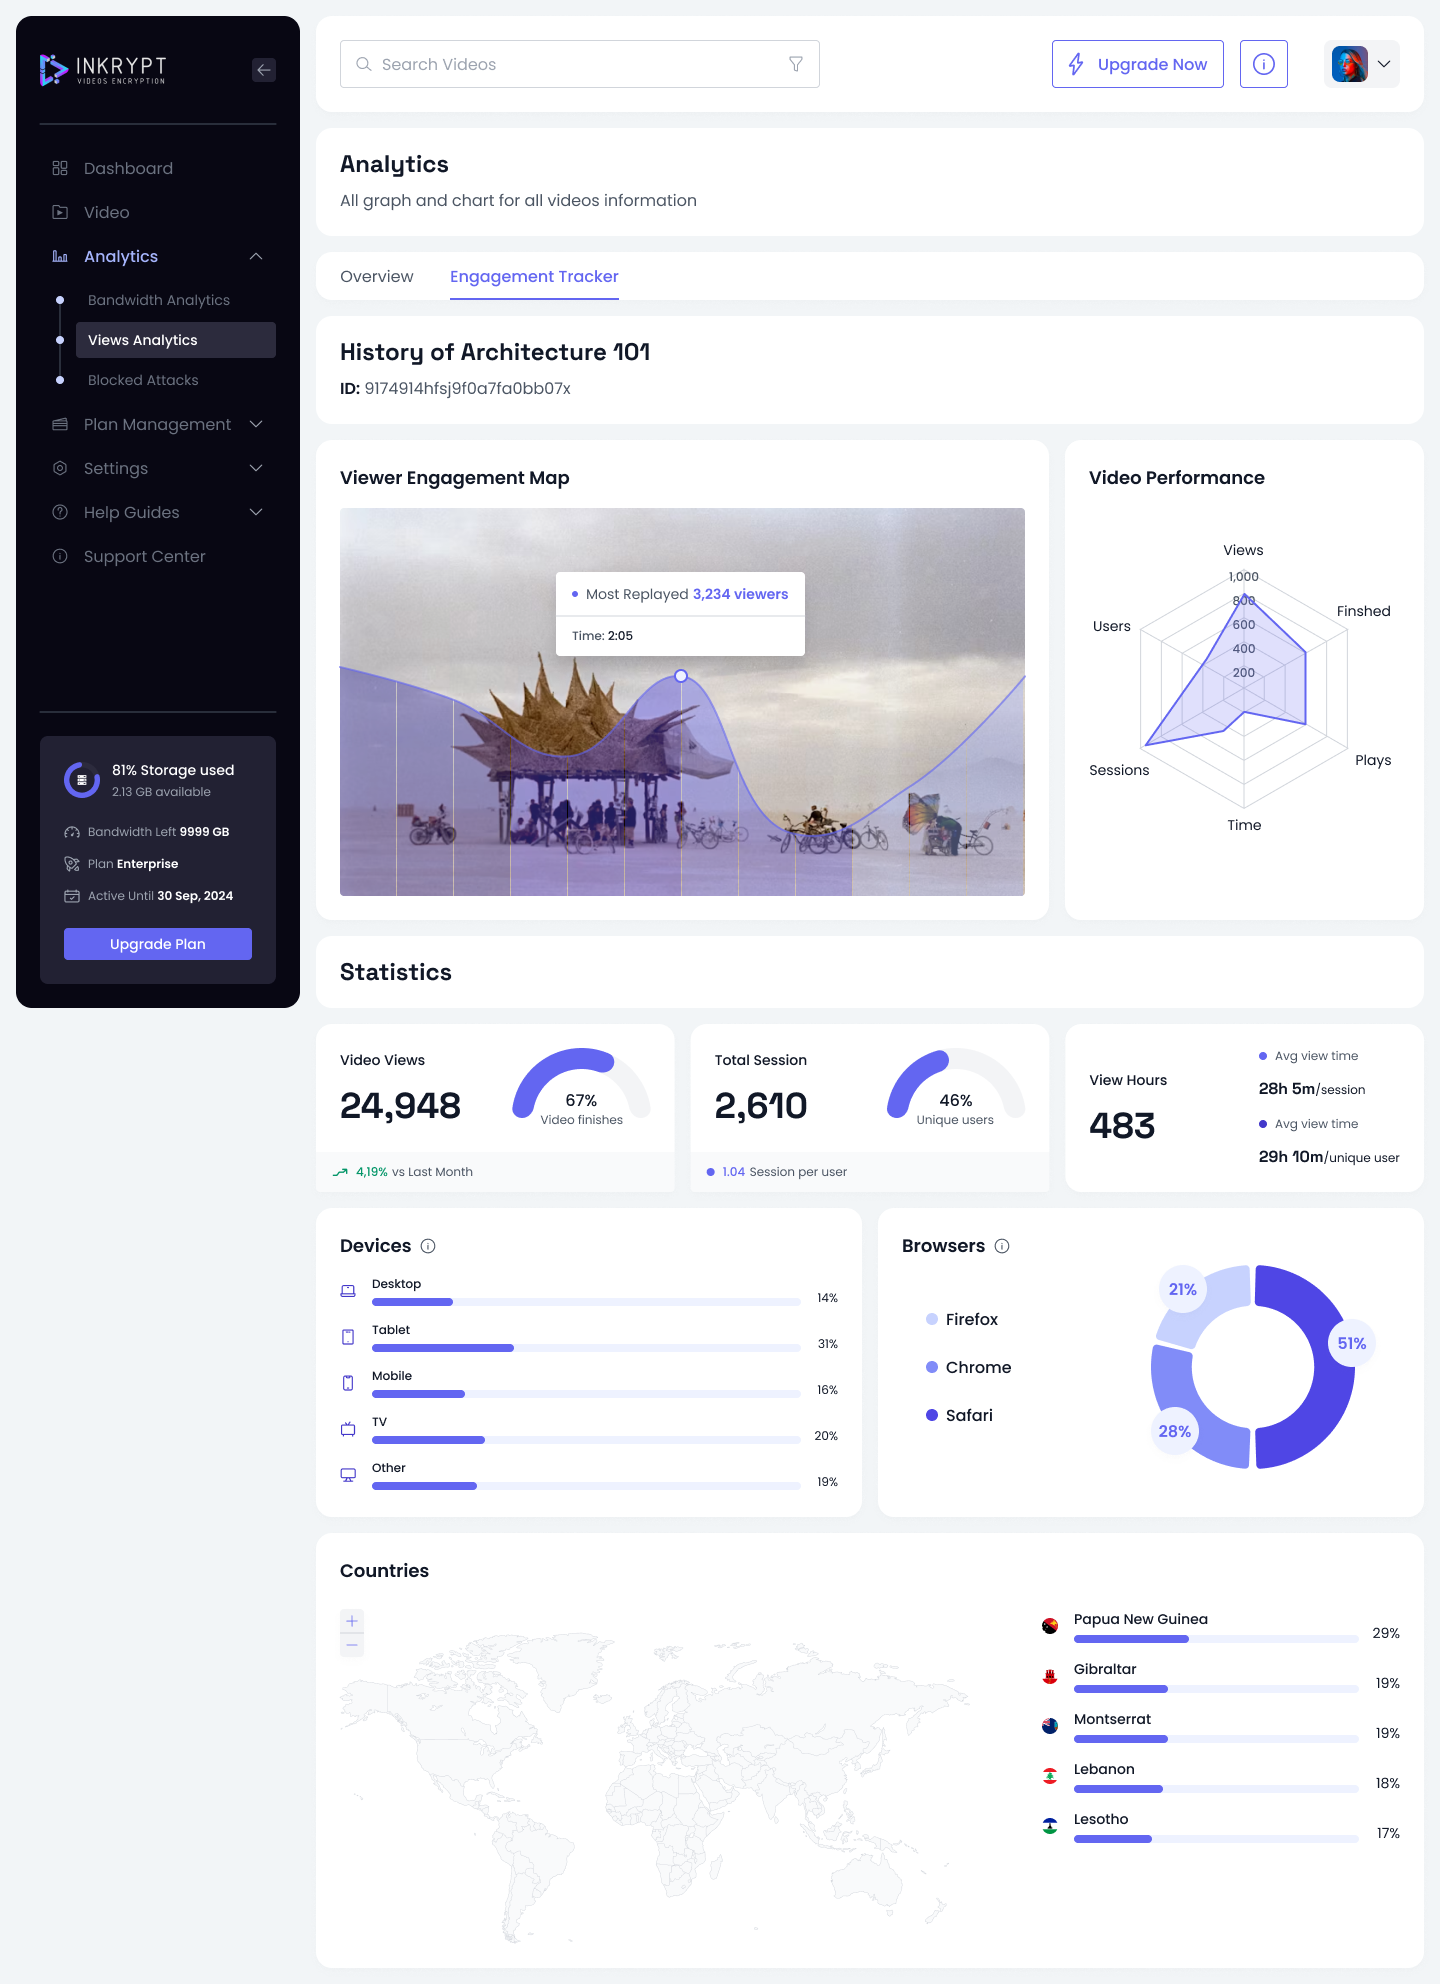
- Viewer Engagement Map: A timeline graph showing the points in the video that were most and least replayed. Use this data to identify content that resonates with your audience.
- Video Performance Metrics: Key metrics displayed in a radar graph, including:
- Views
- Plays
- Time Played
- Sessions
- Finished Videos
- Users
Detailed Metrics
Devices and Browsers
- Devices: Displays a breakdown of devices used by your viewers, such as Desktop, Tablet, Mobile, TV, and Others.
- Browsers: Highlights the percentage of users viewing your content through browsers like Chrome, Firefox, and Safari.
Geographic Insights
- Countries Map: Visual representation of viewer distribution across the globe.
- Top Countries: Lists the countries contributing the most views, displayed with percentages.
Performance Metrics
The Performance Metrics section lets you drill down into specific videos with a combination of graphs and tables:
- Timeline Graph: Displays daily metrics such as:
- Video Views
- Video Finishes
- Total Play Time
- Average View Time
- Total Sessions
- Unique Users
- Sortable Table: A list of videos with sortable columns for various metrics. Click the dropdown menu to sort by Video Views, Total Play Time, Average View Time, or other key indicators.
How to Use the Data
- Optimize Content: Use the Viewer Engagement Map to identify the most engaging parts of your videos and replicate similar strategies in future content.
- Targeted Outreach: Use geographic and device data to optimize marketing efforts and tailor content for specific audiences.
- Measure Success: Track key performance indicators (KPIs) over time to understand how your videos are performing and where improvements are needed.